- Home
- Grid Information
- Load
- Load Forecast
Load Forecast
This page contains information related to ERCOT’s Mid-Term Load Forecast (MTLF) and Long-Term Load Forecast (LTLF) and Winter 2025-2026 Load Forecast for the Reliability Standard Magnitude.
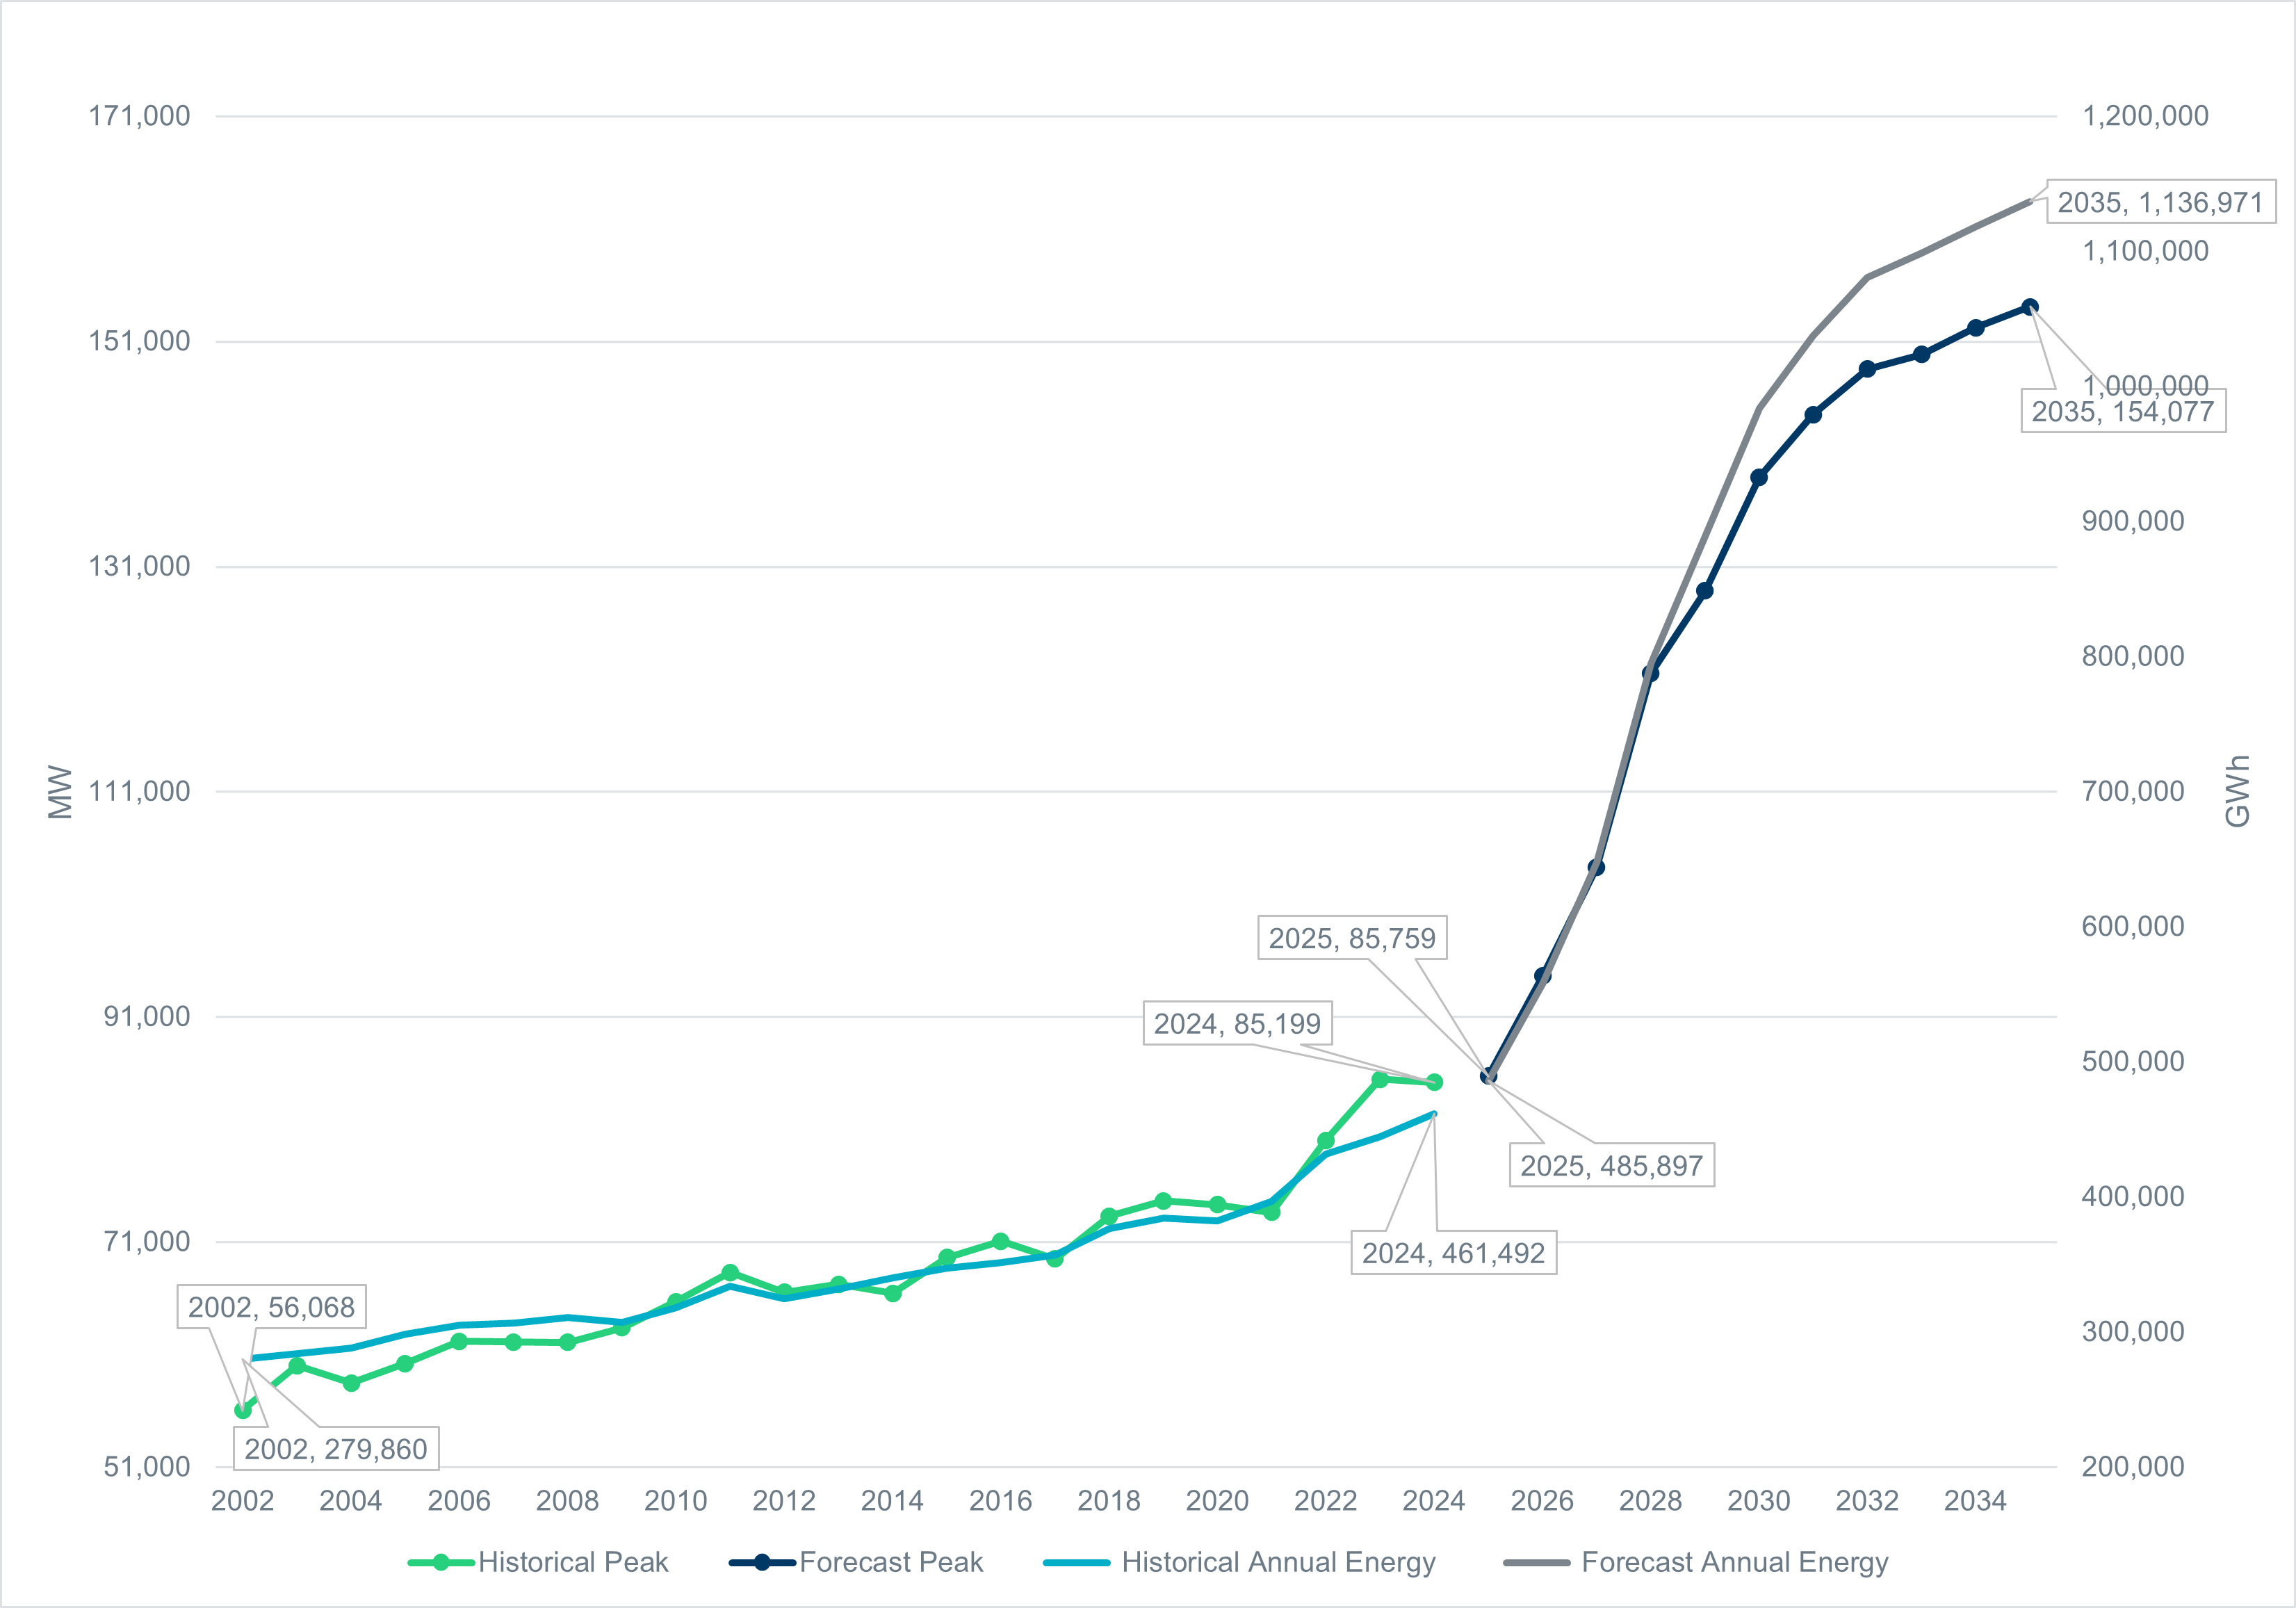
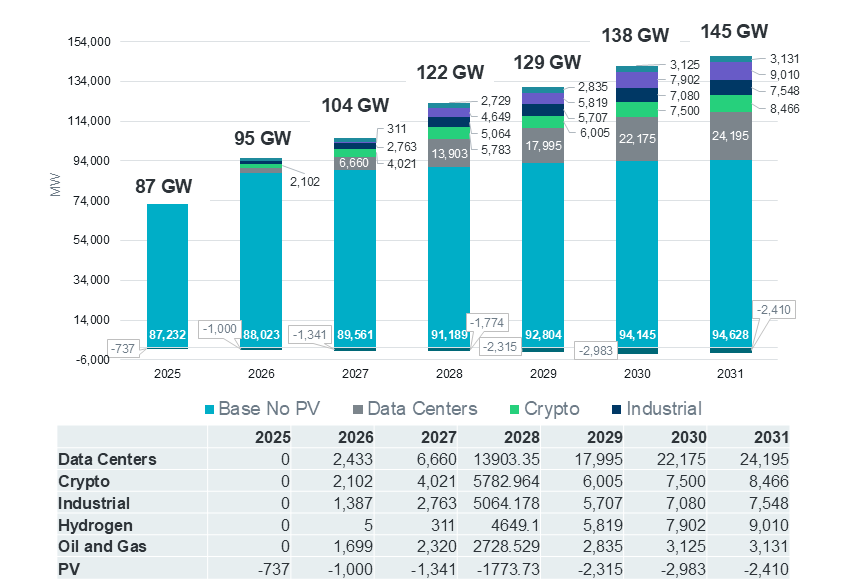
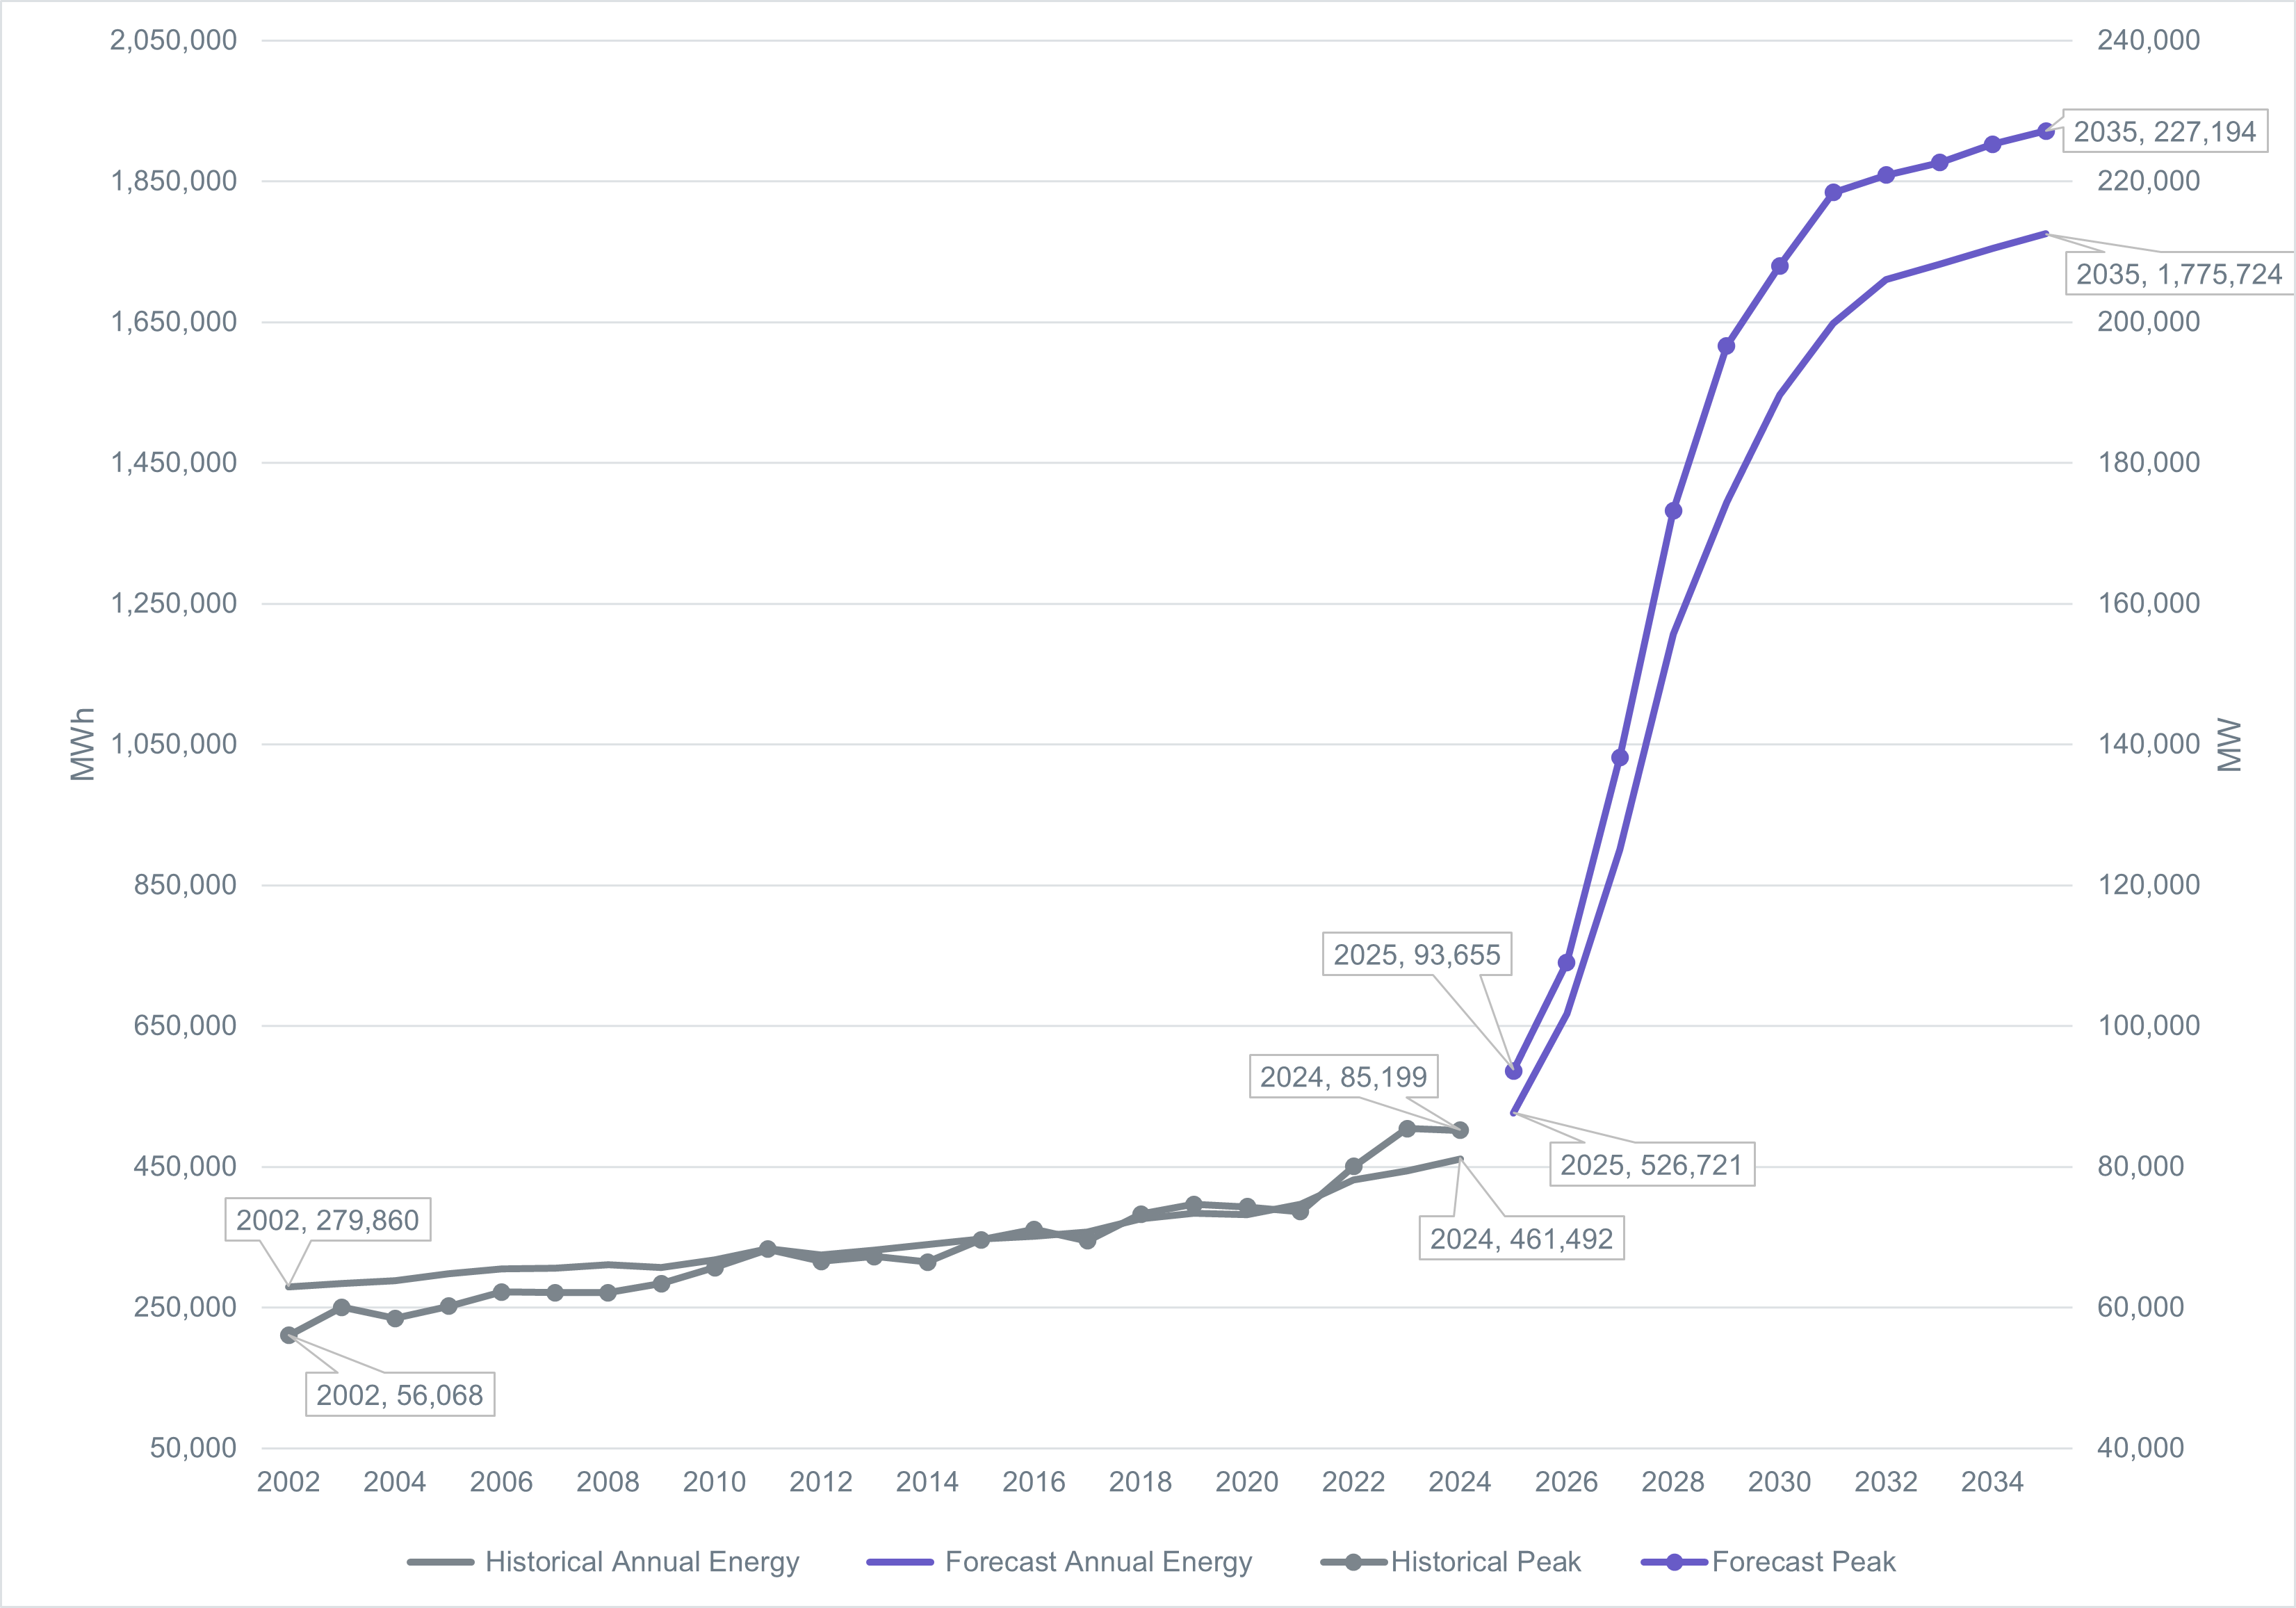
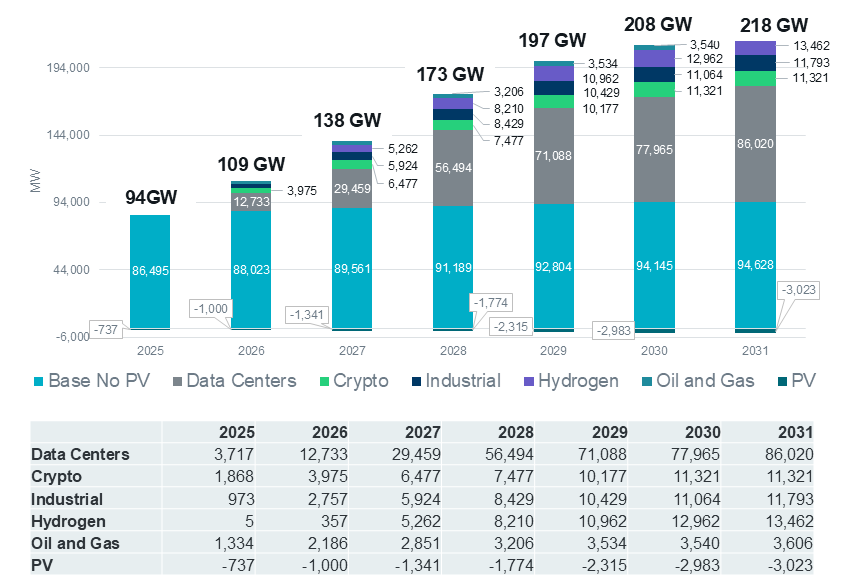
Long-Term Load Forecast
The Long-Term Load forecast is an hourly forecast for the next 10 years. It is based on forecasted economic data and historical weather from 2008–2022.
*Click on image to view it in greater detail.
2025 Long-Term Load Forecast Reports 2025 Long-Term Load Forecast Reports
2025 Load Forecast Scenarios 2025 Load Forecast Scenarios
Weather Year Scenario Forecast - By Weather Region Weather Year Scenario Forecast - By Weather Region
Mid-Term Load Forecast
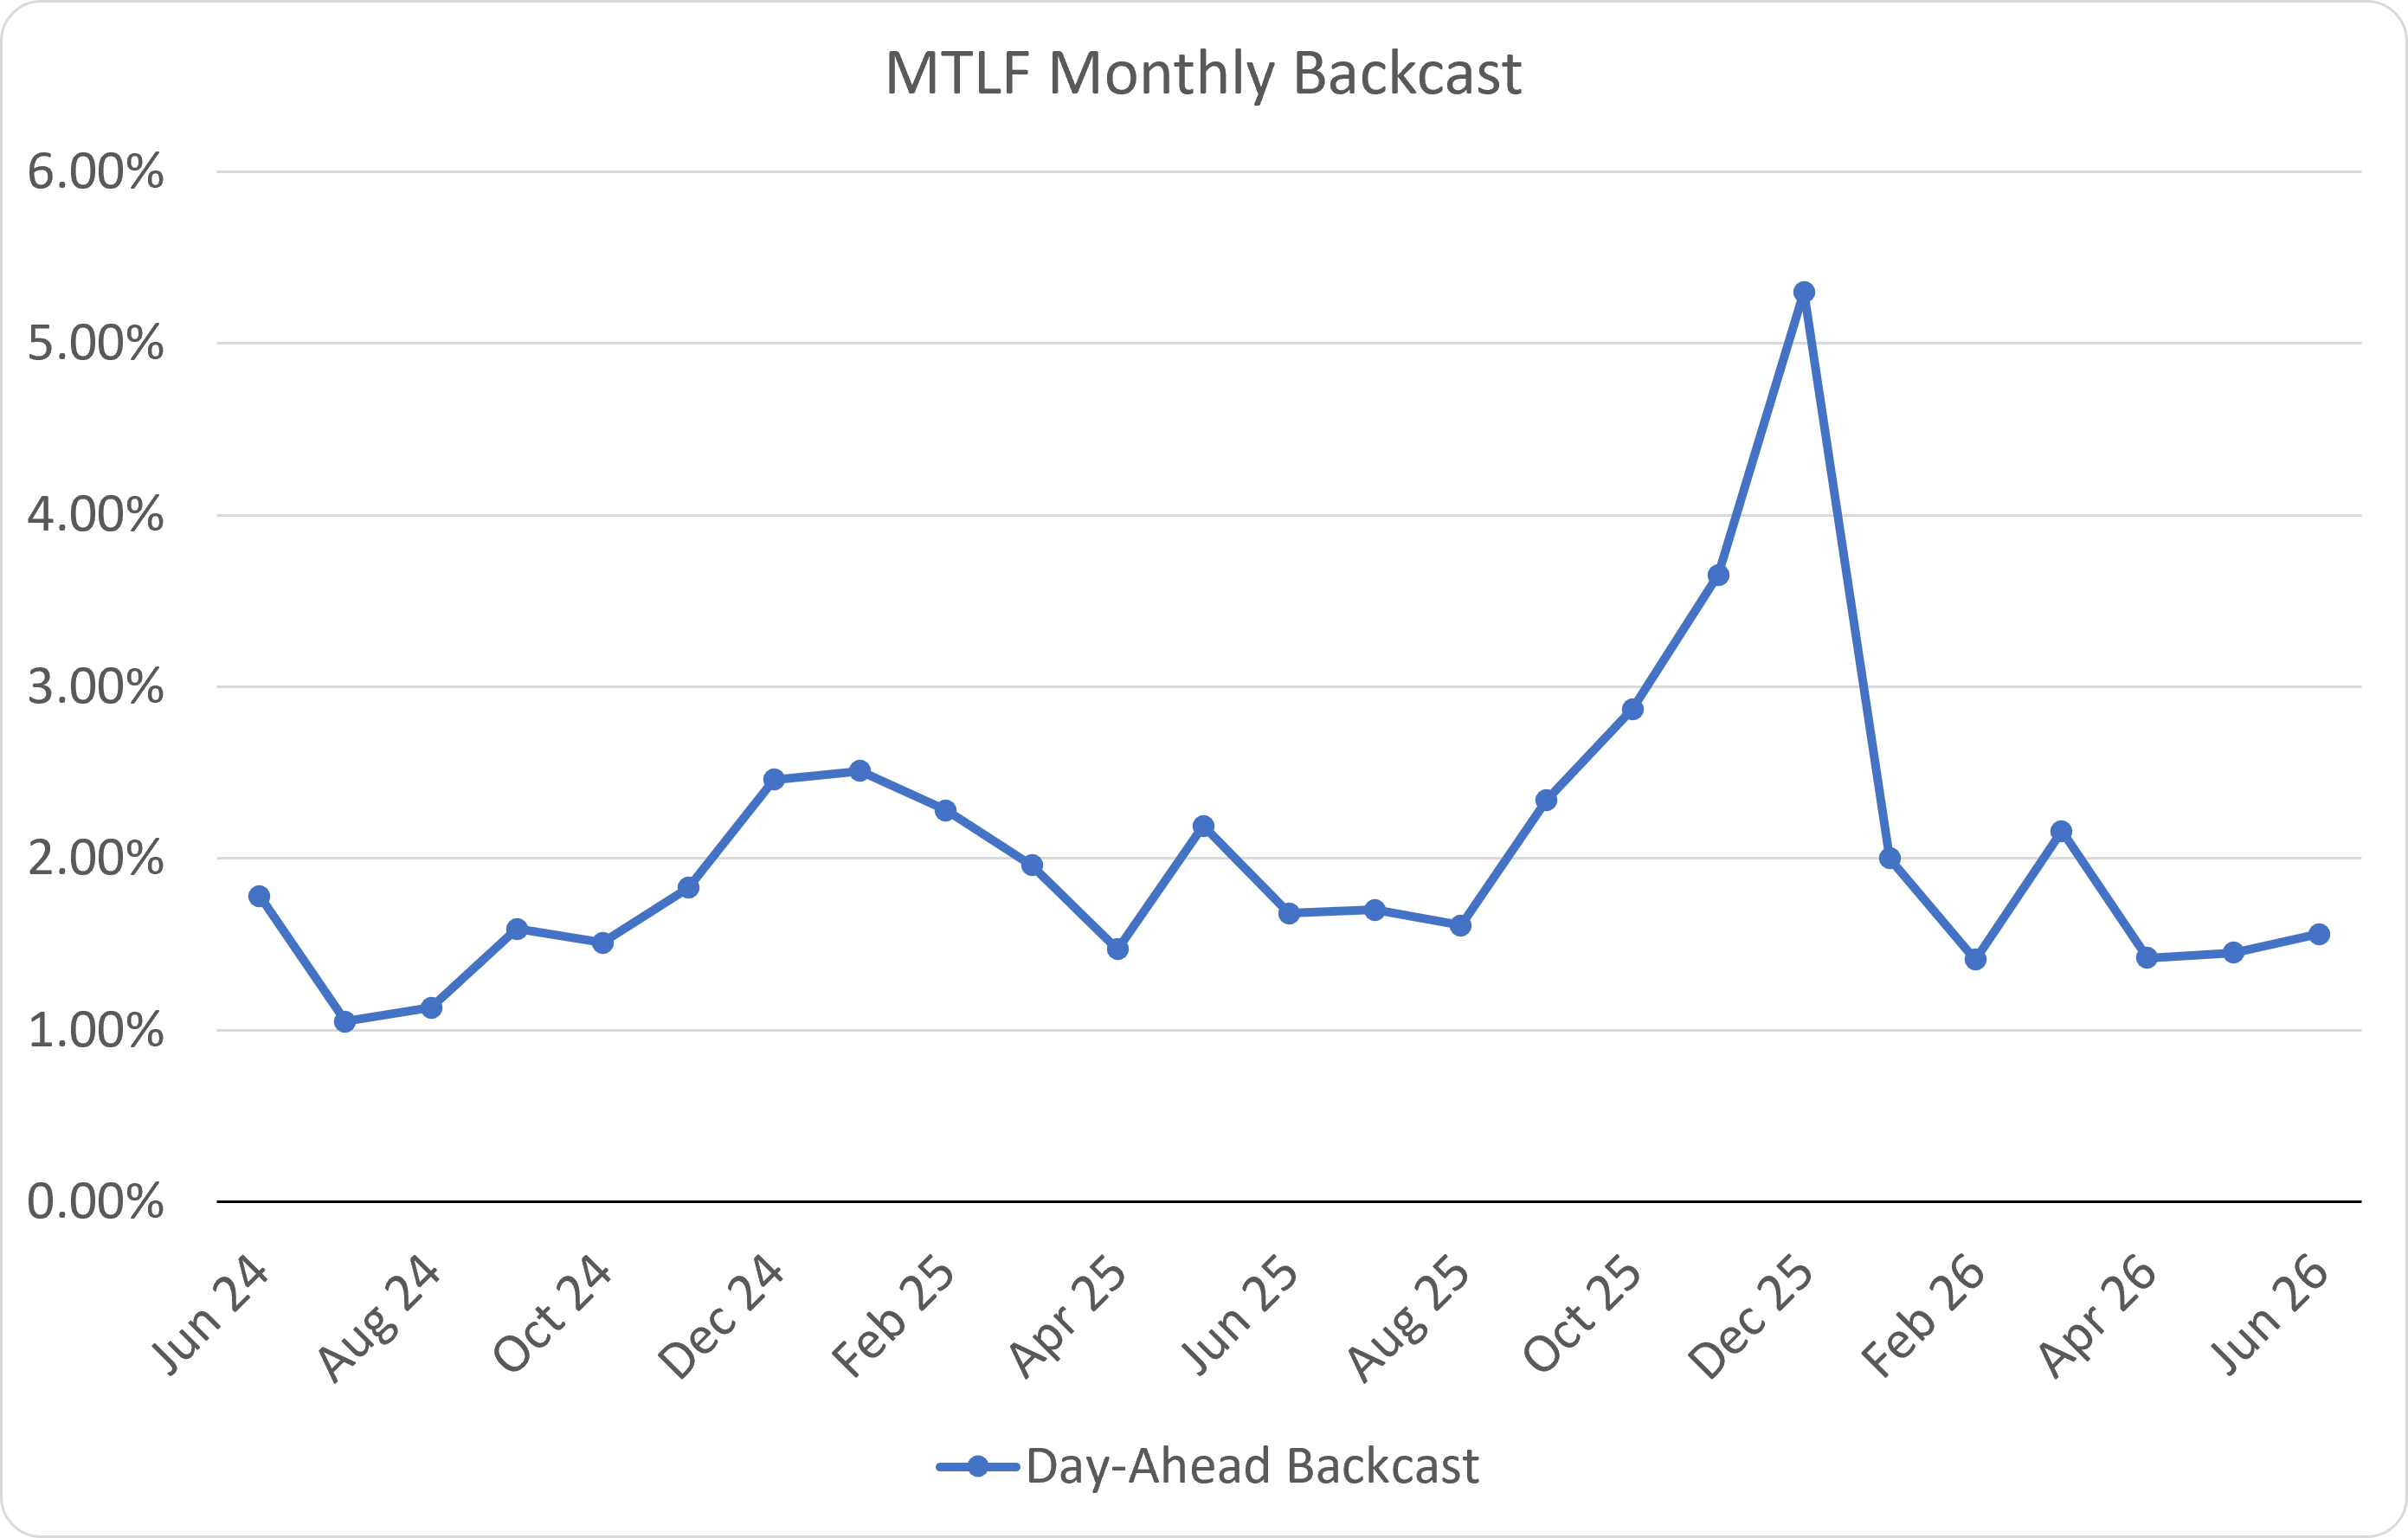
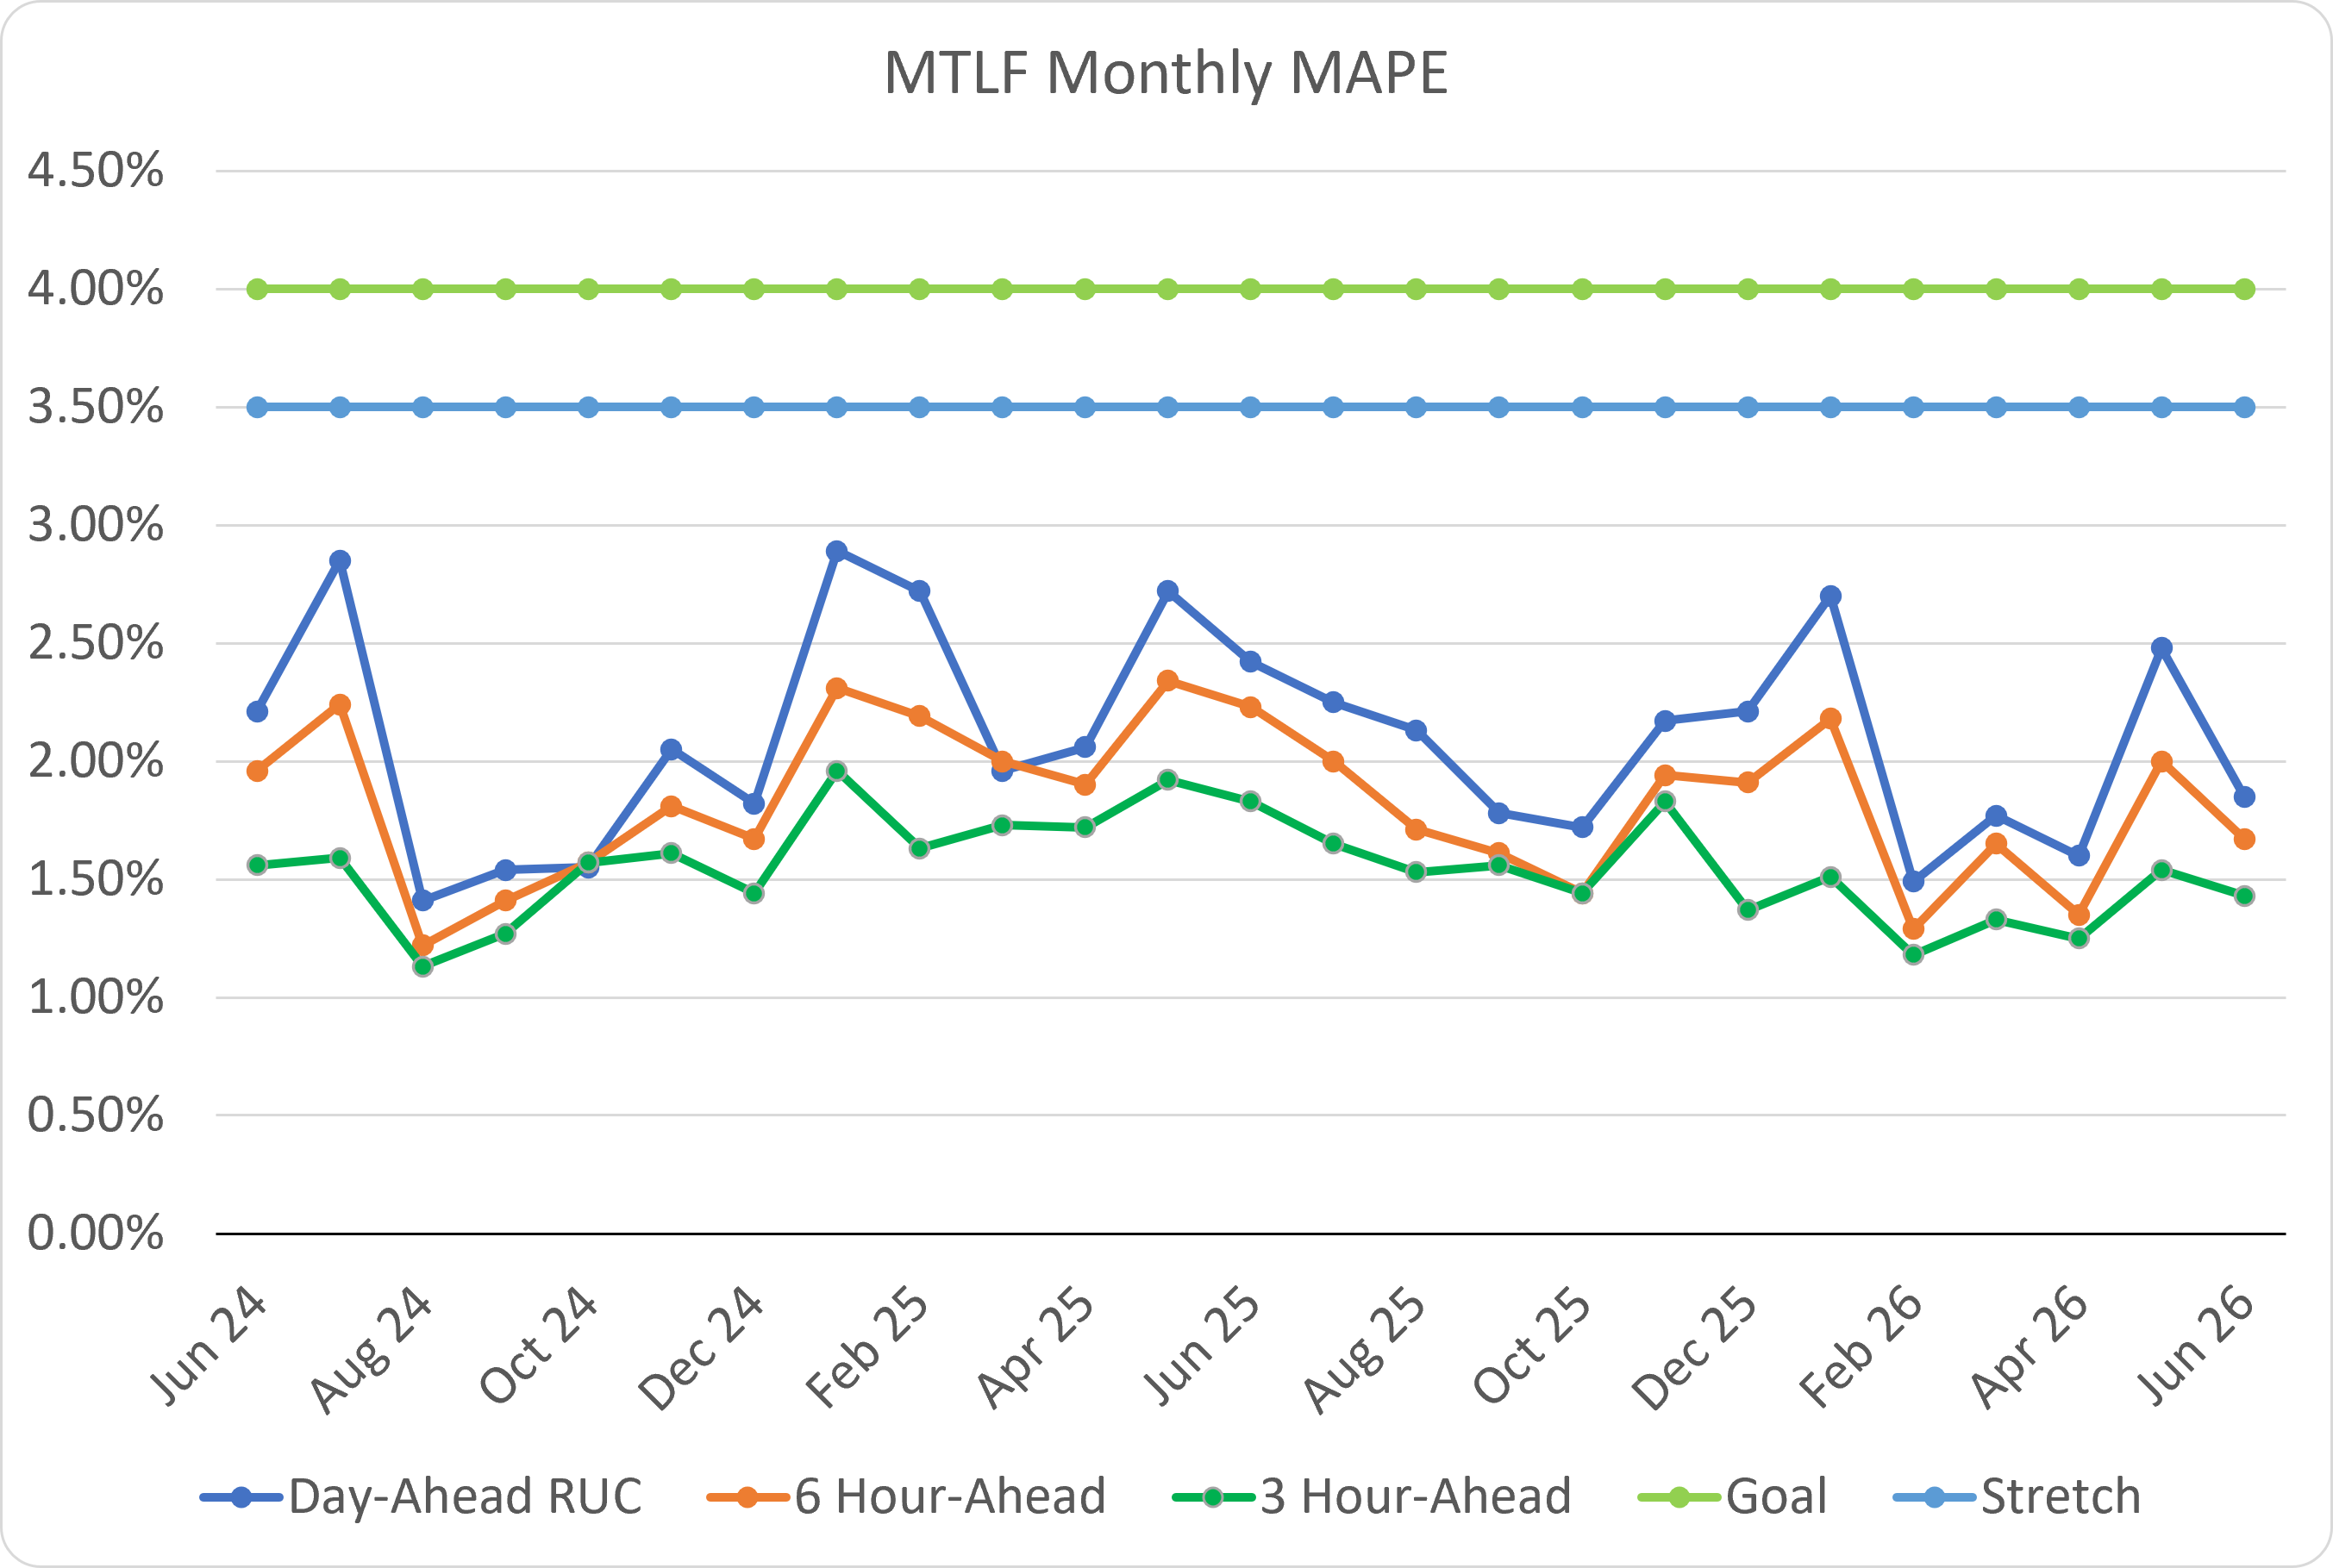
The Mid-Term Load forecast (MTLF) is an hourly forecast for the next 168 hours based on current weather forecast parameters within each Weather Zone. The MTLF Monthly Mean Absolute Percentage Error (MAPE) chart below contains average MAPE values for the 3 hour ahead, 6 hour ahead, and day ahead forecast horizons for each calendar month. The MTLF Monthly Backcast chart contains the average model error for each calendar month. Note that a backcast is created by using the current MTLF forecast models with actual weather data and calendar variables (day-of-week, holiday) as input. The backcasted values are then compared to the actual load values to arrive at model error.
*Click on image to view it in greater detail.